
The Office for Health Improvement and Disparities (OHID) has published the latest report from the UK National Diet and Nutrition Survey (NDNS), which shows results for 2019-2023.
The NDNS is a continuous cross-sectional survey of the general population aged 18 months and over living in private households in the UK, that has been running since 2008. Consumption of food and drink intake is recorded by participants for up to 4 days, along with the collection of blood and (since 2013) urine samples. The survey is used by UK governments to monitor progress towards achieving diet and nutrition objectives and to develop food and nutrition policies. The report publishes a summary of key information whilst complete NDNS data and additional variables are publically available via the UK Data Service. Stored biological samples are accessible for further health-related research through the NDNS Bioresource.
Dietary recommendations not being met
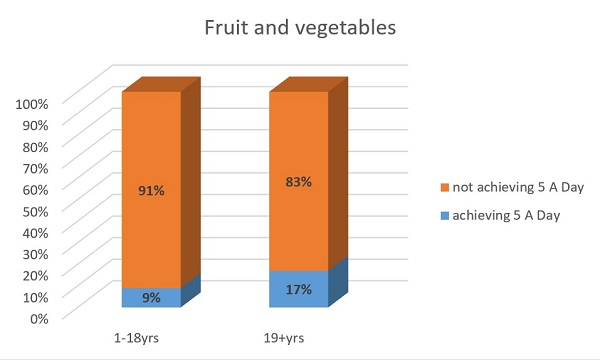
These latest results showed that most of us are not eating enough fruit and vegetables with less than 1 in 10 children aged 11 to 18 years and less than 1 in 5 adults meeting the 5 portions a day recommendation.
Average intakes of saturated fats and free sugars exceeded the recommended maximum. Overall, 85% of children aged 18 months to 18 years and 82% of adults did not meet the recommendation that saturated fat should contribute no more than 10% of energy (calories). The proportion meeting the recommendation for free sugars, no more than 5% of energy, was even lower, with 91% of children and 81% of adults not meeting the recommendation. Free sugars are those sugars added by the manufacturer, cook or consumer plus sugars naturally present in fruit juices, honey and syrups.
Most did not meet the fibre recommendations of at least 30 g per day for adults and 15 to 25 g per day for children (depending on their age).
Nutritional status – some nutrients need attention
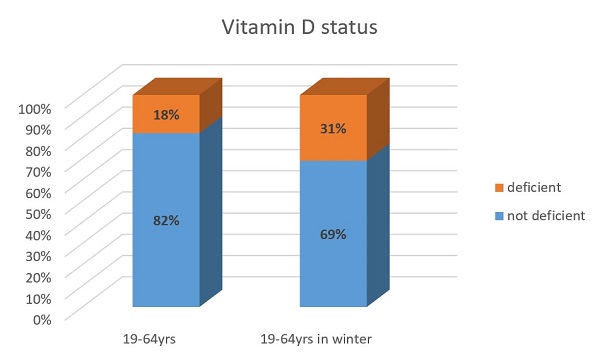
Vitamin D deficiency is defined, in relation to bone health, as a 25-hydroxyvitamin D serum concentration of less than 25 nmol/L. Nearly 1 in 5 (18%) adults aged 19 to 64 years were classified as vitamin D deficient in the period 2019-2023, but during the winter (January to March), this rose to 31%. 23% of children aged 11 to 18 years were vitamin D deficient, rising to 36% in winter. In younger children (aged 4 to 10 years) and adults aged 65 years and over, 10% and 12% respectively were vitamin D deficient.
Low folate status in women of childbearing age (16 to 49 years) continues to be a concern in UK. In the latest round of NDNS, 83% of these women had a red blood cell folate concentration of less than 748 nmol/L, below which there is an increased risk of a pregnancy affected by neural tube defects. Implementation of mandatory folic acid fortification of non-wholemeal wheat flour is expected from the end of 2026 and monitoring of folate status will continue as part of future rounds of NDNS.
Population iodine status is assessed by the measurement of iodine concentration in urine samples. Whilst most age and sex groups had median iodine concentration indicating sufficiency, there was evidence of insufficient population status for girls aged 11 to 18 years and in women of childbearing age (16 to 49 years). Notably, between 2013 and 2023 urinary iodine concentration decreased by 29% for girls aged 11 to 18 years and 25% for adults aged 19 to 64 years.
Evidence of health inequalities
The NDNS found that those in higher income households in the UK were closer to meeting some dietary recommendations. Reported intakes of fruit and vegetables and fibre increased with increasing income across all age groups.
The report also looked at diet and status in relation to Index of Multiple Deprivation (IMD) for households in England only and found that those in the most deprived areas tended to have poorer diets. Across all age groups, consumption of 5 A Day fruit and vegetable portions was lowest in those living in the most deprived areas, while intake of free sugars as a percentage of energy was highest. Although not seen consistently across all age groups, fibre was also lowest in those living in the most deprived areas.
Eating out of home
For those who consumed food from the out of home sector, almost a quarter (23%) of energy (calories) came from this source. The most popular were ‘fast food’ or ‘take-away’.
Polly Page, who leads the Nutrition Measurement Platform at the MRC Epidemiology Unit, said:
The National Diet and Nutrition Survey provides an insight into the nation’s nutritional wellbeing and is a vital information source for policy makers and researchers. Beyond the published report, the full dataset includes many more nutrients and analytes which are available to researchers for further study, along with the NDNS Bioresource of blood and urine samples.
Our thanks are owed to more than 4,300 randomly selected members of the UK public who participated in the NDNS during 2019 and 2023, whose collective contribution of more than 14,000 days of dietary information, 1,000 blood samples and 2,000 urine samples underpin our results.”
About the National Diet and Nutrition Survey
The National Diet and Nutrition Survey is jointly funded by the Department of Health and Social Care (DHSC) and the UK Food Standards Agency. Scientifically led by the Cambridge Nutrition Measurement Platform at the MRC Epidemiology Unit, working in conjunction with our consortium partner National Centre for Social Research (NatCen).